
The Fed continues to navigate a tricky balancing act, taking what could be considered a hawkish pause in June, with the express intention of raising rates again later to get headline consumer inflation down from its current 4% to its average 2% target.
The pause could have been viewed as not being tough enough on inflation, leaving the economy laden with the effects of runaway inflation for a longer time. However, investors continue to be more dovish than the Fed, expecting fewer than the two rate hikes priced into the Fed’s dot plot this year. Thus, the gap between financial markets and Fed guidance has narrowed but has not entirely disappeared. The CME FedWatch tool currently shows that financial markets are pricing in an 86.8% chance of a 25-basis point rate increase at the July meeting.
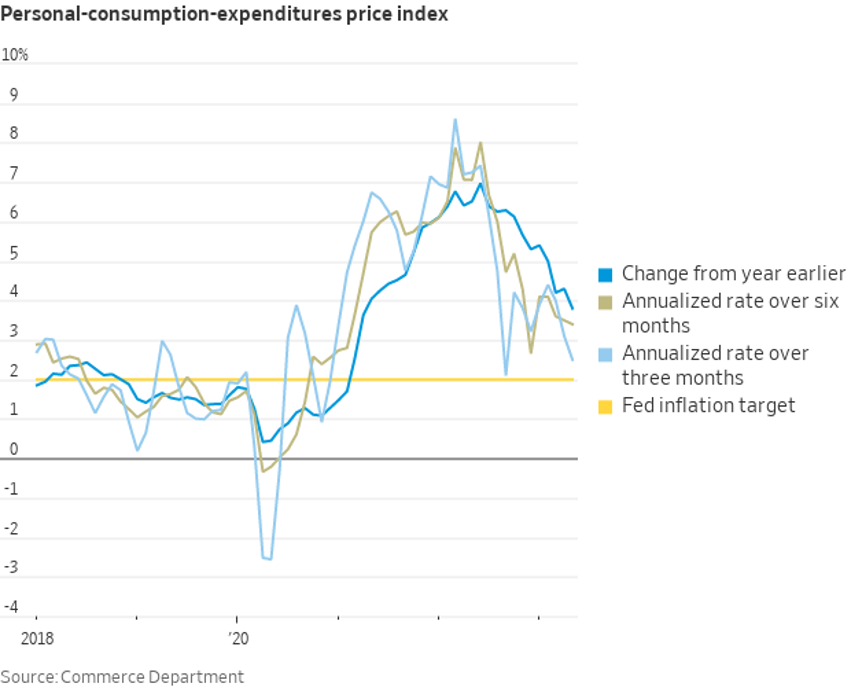
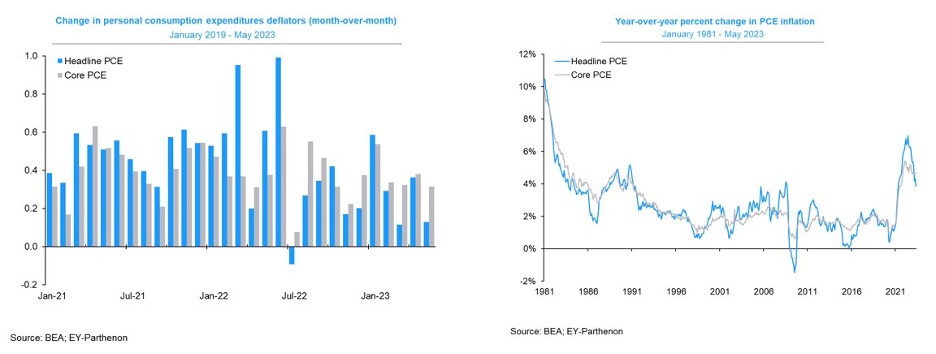
For now, price increases are moderating but remain more stubborn than Fed officials might prefer. Overall the Fed’s preferred measure of inflation, the personal consumption expenditures price index, cooled to 3.8 percent in the year through May – the first time it has slipped below 4 percent since early 2021.
But a “core” inflation measure that strips out food and fuel costs — which move around a lot — remains stubbornly high at 4.6% from a year earlier, the fifth month that it has been either 4.6% or 4.7%. Officials closely watch that measure for a sense of how quickly prices will increase in the months and years ahead – and the rate it is currently growing month on month will remain well above the Fed’s target.
The Fed’s PCE measure of Services inflation, excluding energy services and housing costs, softened in May to 4.53% on a year ago. It has been one of the inflation segments that has been a specific worry for the Fed because, as Chair Jerome Powell said at a European Central Bank event in the last week of the month, “it’s the place where we haven’t really seen much progress.”
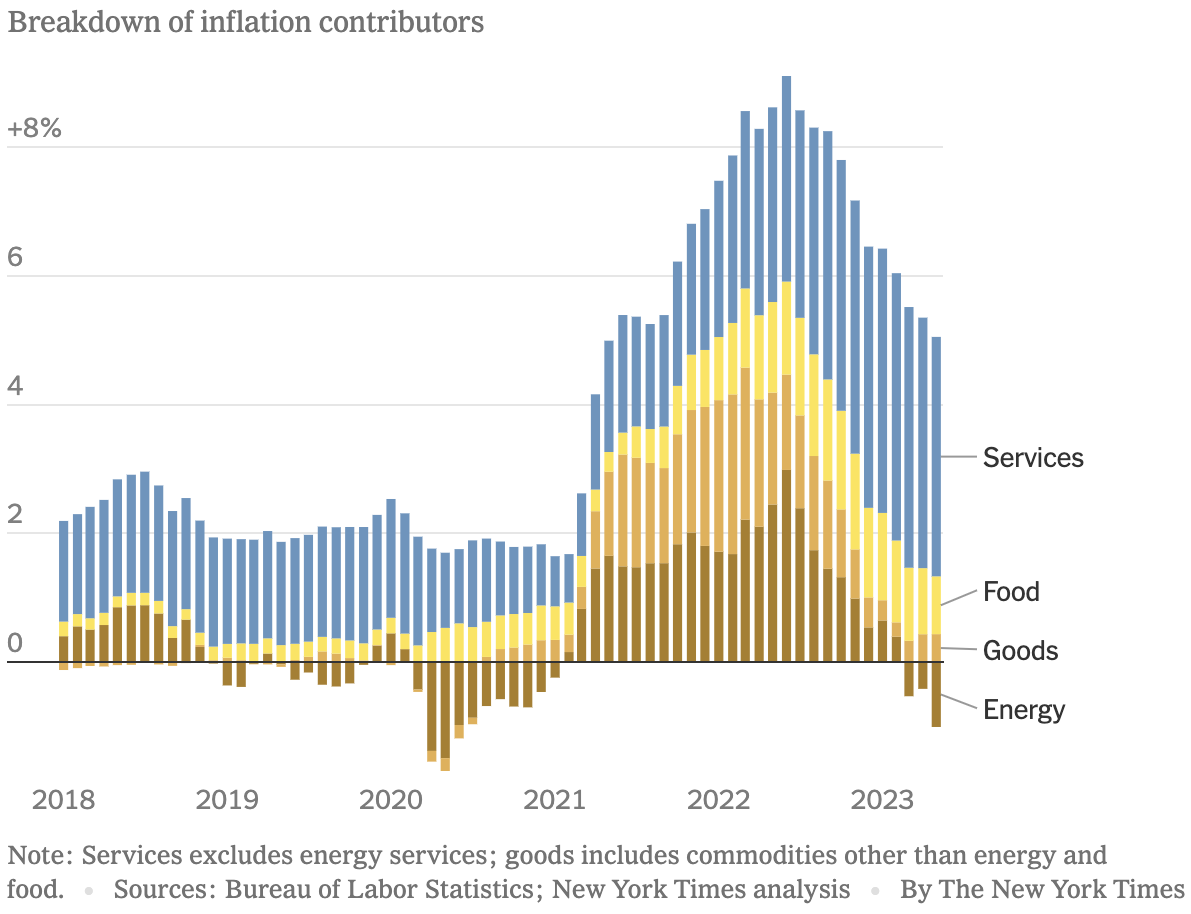
According to the consumer price inflation data released mid-month, which came in at 4% year on year, food prices were up 6.7% from a year ago, energy prices were down 11.7%, and shelter costs were up 8%.
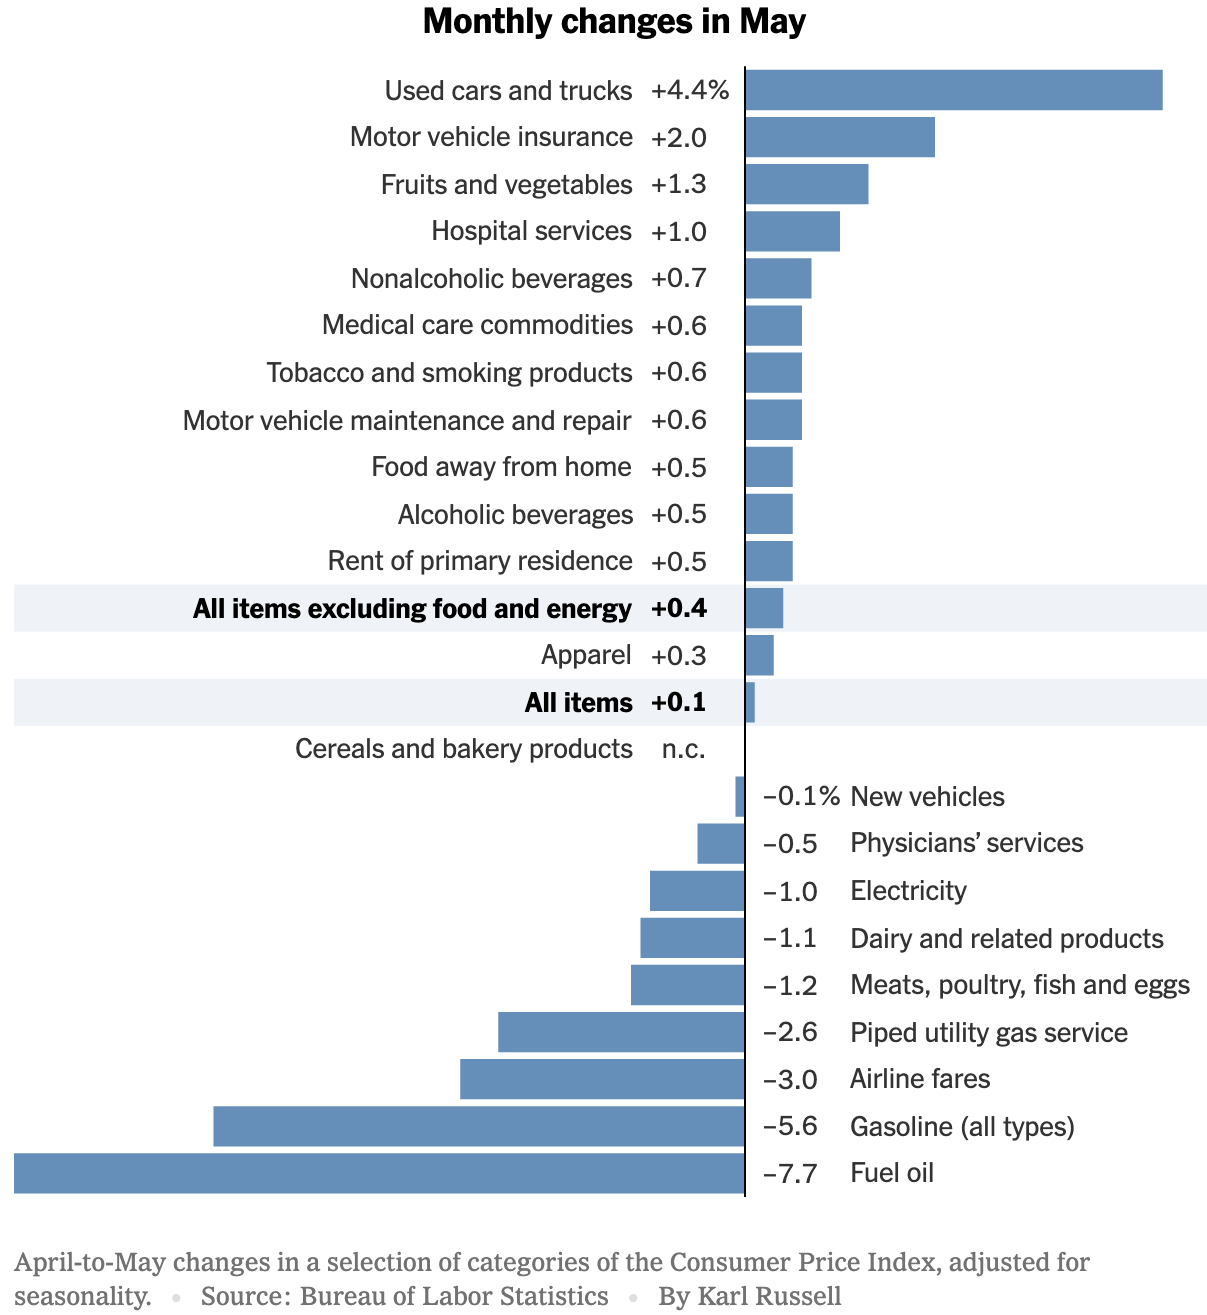
Though inflation may have come off its heady highs of more than 9% at the peak of the inflation cycle, prices are by no means lower. Costs for used cars, up 4.4% on a month ago in May, motor vehicle insurance (2.2%), fruits and vegetables (1.3%), and hospital services (1%) are all still rising at worrying paces.
Investors Need to be Mindful of Long-Term Inflation
The low-inflation, low-interest era is likely behind us. Though central banks are committed to bringing inflation down, macroeconomic trends, like deglobalization, may raise the cost of goods. Manufacturers in specific industries, particularly the chip, pharmaceutical, and defence industries, will no longer be producing the goods where input costs are lowest, which may raise the cost base.
Long-term inflation erodes purchasing power and undermines certain asset classes that have more difficulty providing real returns after considering inflation. History shows that cash and money market funds, though attractive because they are low risk during times of uncertainty, often don’t provide real returns over extended periods.
Asset classes that have proved themselves at one point or another as inflation hedges include stocks, a traditional 60:40 investment portfolio that offers diversification across equities and fixed income assets, the safe-haven of gold, commodities, real estate investments, and Treasury inflation-protected securities (TIPS), a type of U.S. Treasury bond that is specifically structured to protect holders from inflation.
June stock markets continue to shrug off headwinds
Stock markets continued their rally through June and have done reasonably well year to date, perhaps surprisingly, given the various headwinds that have faced investors. These include Fed tightening, the threat of recession, the prospect of a U.S. debt default, and a mini-banking crisis that saw three regional banks fail.
The banking crisis has continued to lurk in the background, with fear of becoming a more systemic problem across financial markets. However, it looks contained for now.
During June, the S&P500 continued its upward trajectory, increasing 6.5%, which means it has gained 15.9% since the beginning of the year. The Nasdaq almost doubled that year to date, rising 31.7% on the back of the sharp increase in tech shares.
Canada’s S&P/TSX Composite Index lagged the U.S. stock market performance, increasing 3% during June and adding 3.97% since the beginning of the year. Europe put in a similar monthly performance of 3.2% but rallied more vigorously in the first half of the year, up 14.5% year to date. The UK FTSE 100 has been the worst developed market performer, as the economy grapples with far higher inflation than its counterparts, and the economic outlook is gloomy, with concerns stagflation is setting in.
Another Paradox: S&P 500 Index is Expensive, but Most Stocks are Cheap
The U.S. market dominated attention, as companies marketing their A.I. capabilities are swept up in the everything-AI exuberance. Though U.S. stock market indices have, in the aggregate, advanced precipitously since their steep sell-off in 2022, most of the market returns have been driven by the enormous amount of excitement for a few stocks.
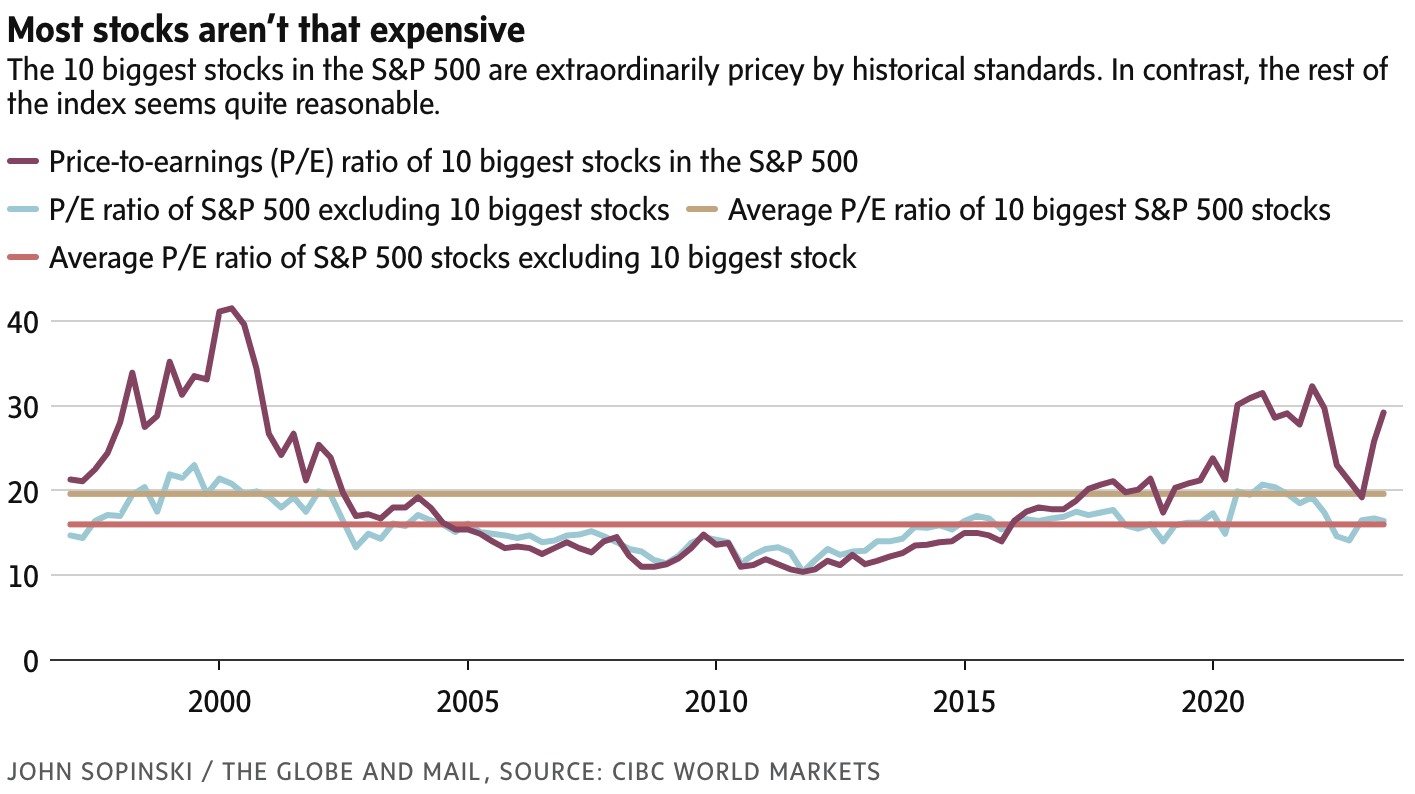
This occurrence has created an interesting valuation anomaly, with the top 10 index constituents appearing quite expensive while most of the other 490 companies are reasonably priced. The chart below from CIBC World Markets shows the influence of the top 10 stocks.
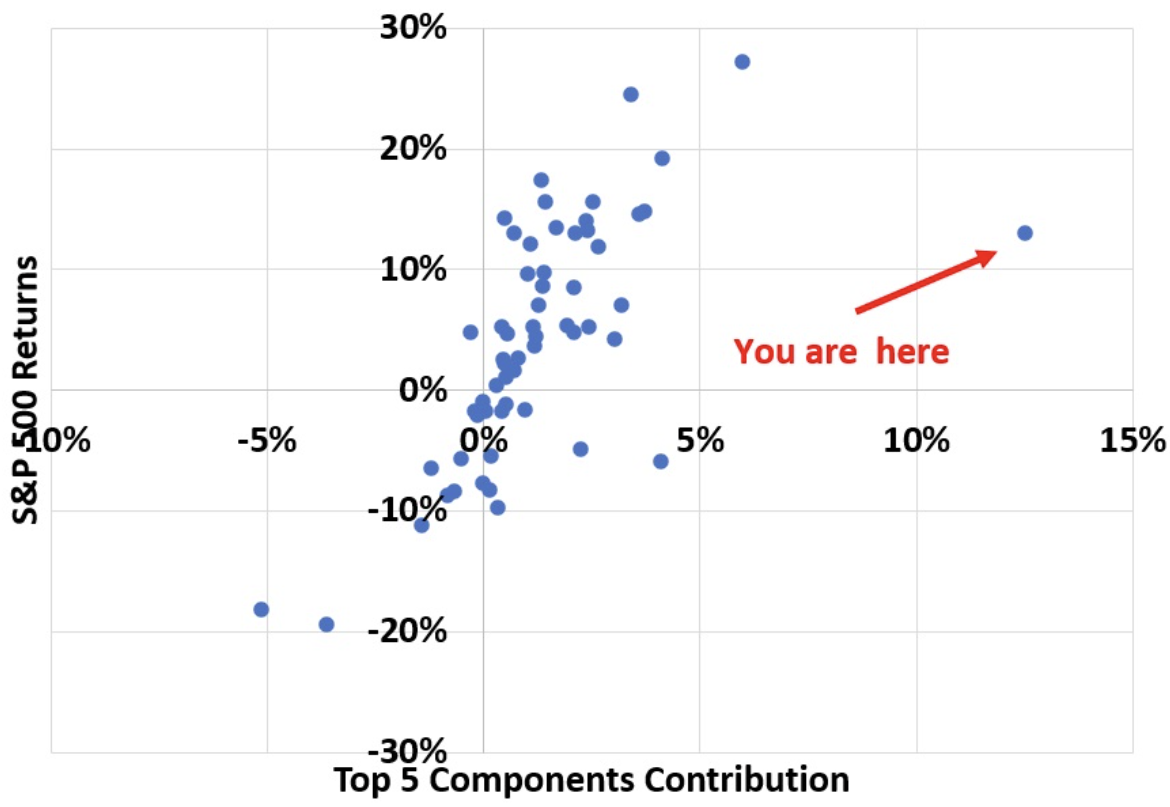
Christopher Schwartz, Associate Professor of Finance at UC Irvine’s Paul Merage School of Business, produced the chart below, which illustrates that of the 13.0% gain of the S&P 500 YTD (to June 12), 12.5% was produced by just five companies (Apple, Amazon, Google, Nvidia, and Tesla), the top 5 components. The contribution of the remaining 495 companies has been trivial. The analysis covers the years from 1965 to 2023 and looks at returns of the S&P500 up to June 12 of each year. The dot farthest to the right is the situation for 2023, a clear outlier. In an average year, the top 5 components would contribute a lot less to the overall index return, around 20%, whether the market is up or down. However, this year the top 5 companies (all NASDAQ stocks) are essentially responsible for the index returns. The data explains why the NASDAQ is up 30% while the DOW is up only 2%. The research concludes that we are in the most concentrated market EVER!
CIBC head of portfolio strategy Ian de Verteuil says don’t put everything in the tech basket because the top 10 stocks in the S&P500 are trading at 50% above their long-term average, and the other 490 are in line with their long-term average.
Canadian equities are cheaper than the S&P500, with the TSX price/earnings ratio at less than 15 times and below its historical norm. The U.S. index’s P/E is at about 23 times, with the top 10 much higher at 30 times.
The rally, which has seen Nvidia top $1 trillion in market cap and Apple $3 trillion, has raised fears that it could be another bust like the 1999 tech boom. The biggest tech companies now comprise 30% of the S&P 500’s market cap versus 26% before the dot.com bubble in 1999.
There is broad agreement that A.I. is set to alter the world we live in fundamentally, but as with any tech-led economic transformation, only a handful of stocks end up being the long-term winners.
Though there was a slight shift in the balance of performers towards the end of June, with the tech stock rally easing, the hype machine isn’t likely to run out of steam for some time because of the market’s more dovish outlook about the Fed rating hiking cycle. Inflation will determine the Fed’s next move, and if the central bank is forced to raise interest rates several times more, there is a chance that the surprising strength of the economy up to now may take a knock and hurt growth stocks, like these tech shares. As Mike Loewengart, head of model portfolio construction for Morgan Stanley’s global investment office, said in a recent WSJ article, “ The A.I. boom is a very real factor in driving the sector and the market. But it’s important to understand that technological innovation is not always going to translate into durable businesses or durable earnings.”
From all of this, we can say that the “broader market” is relatively cheap, and there are bargains out there even if these companies have not had much influence so far this year. From a valuation and risk management perspective, it may be more prudent for investors to seek opportunities outside the top components of the S&P500. It may even make sense to avoid indexing, given the outsized influence and higher valuation of the top components of the index.
Reversion to the mean is a powerful force in financial markets, and when it strikes next, expect to see a lot of pain for those exposed to the most overvalued and popular stocks.
At the same time, this reversal is likely to be rewarding for long-term patient investors who have managed to seize this disconnect in the market to position their portfolios accordingly.
Overall, a great deal of euphoria has resurfaced in the market, particularly around A.I.’s role in the new technological dawn. While there will no doubt be opportunities, investors need to be discerning in how they position their portfolios to capture such opportunities without being exposed to wealth-destroying risks. The excitement has led many companies to tout A.I. as the key to growth and profitability, but very few have provided coherent strategies about how exactly they will implement Al to benefit shareholders, and just as important stakeholders at large.
Garnet O. Powell, MBA, CFA is the President & CEO of Allvista Investment Management Inc., a firm with a dedicated team of investment professionals that manage investment portfolios on behalf of individuals, corporations, and trusts to help them reach their investment goals. He has more than 25 years of experience in the financial markets and investing. He is also the Editor-in-Chief of the Canadian Wealth Advisors Network (CWAN) magazine. He can be reached at gpowell@allvista.ca