
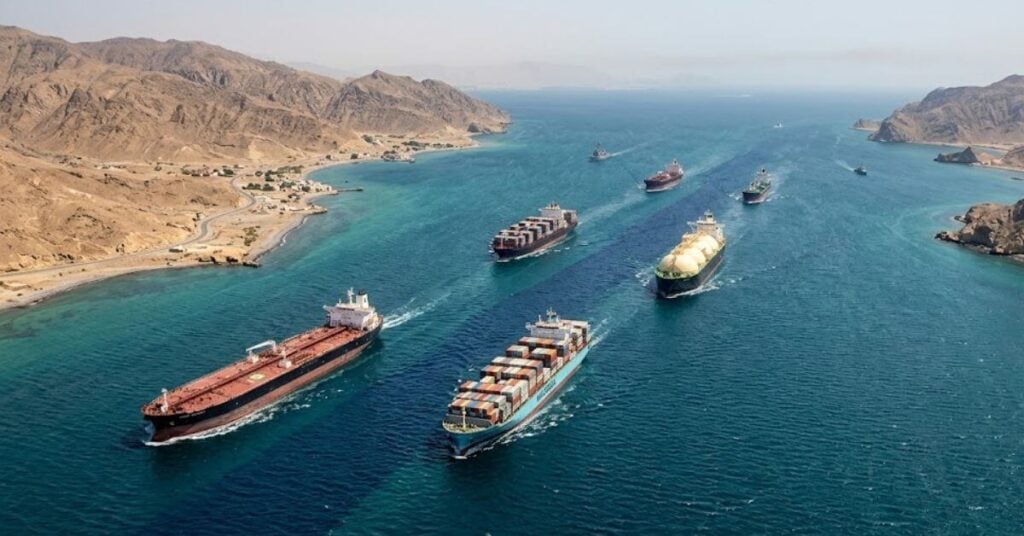
A Market Driven by Geopolitics and Structural Demand
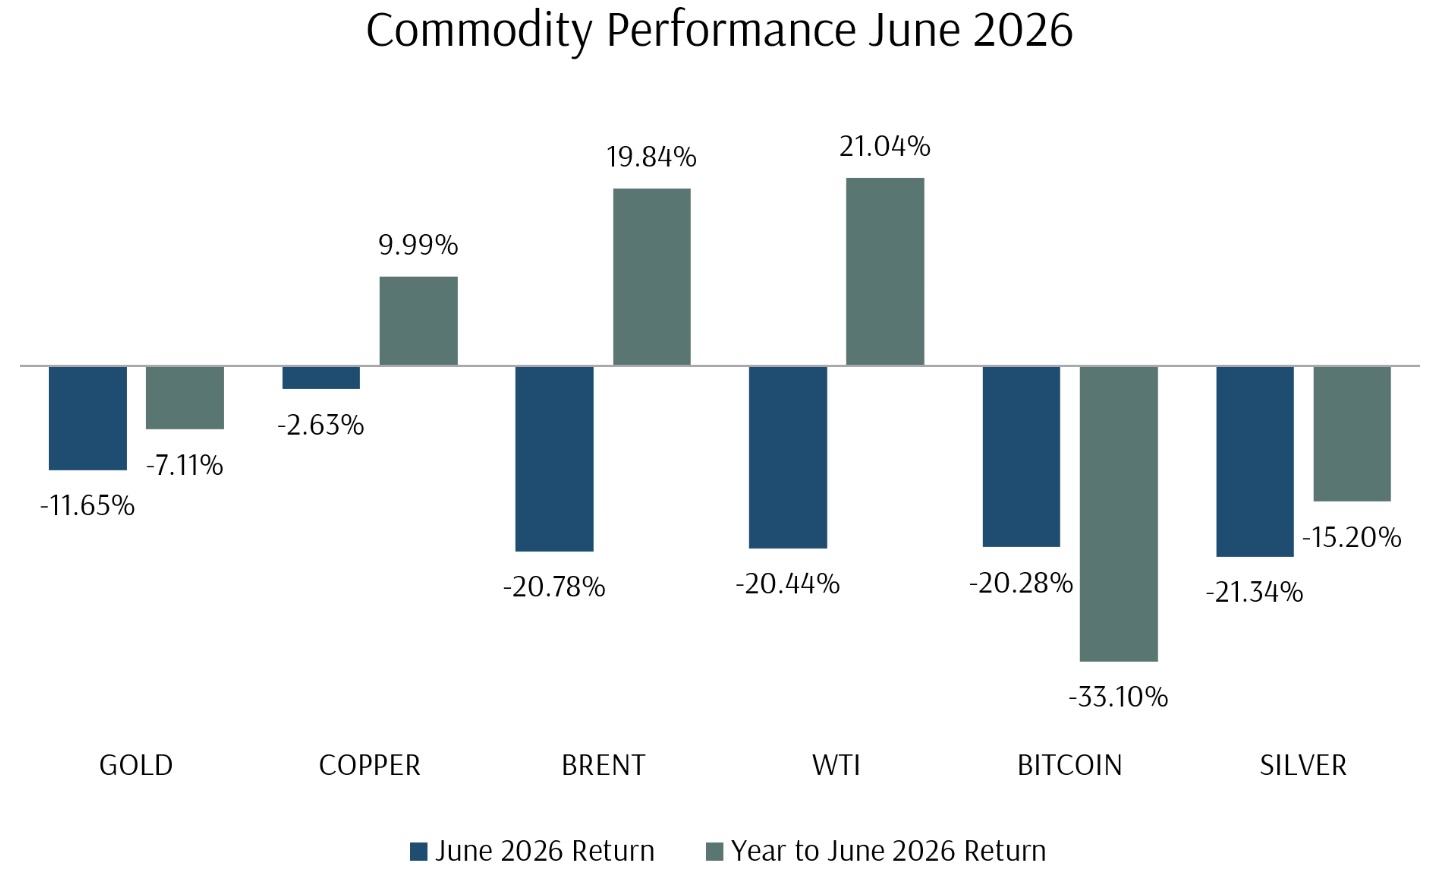
Commodity markets delivered one of the most volatile first halves in years. The US-Israel-Iran conflict, which erupted at the end of February and flared repeatedly near the Strait of Hormuz, dominated the energy and precious metals narrative, while artificial intelligence infrastructure, electrification, and grid build-out continued to reshape demand for copper, silver, and uranium. Weather, from a European heat dome to a brewing El Niño, added a second axis of volatility across agriculture.
Several divergent themes drove commodity prices during the first half of the year. These included:
- Energy prices fed directly into agricultural costs, particularly fertilizer and transport, amplifying the impact of the oil price swings on farm input costs.
- Gas market volatility, especially in Europe, flowed through into fertilizer production costs given natural gas’s role as a key feedstock.
- Copper, silver, and uranium were bound together by the same structural narrative: AI infrastructure build-out, electrification, and grid expansion, distinguishing this cycle from previous commodity super cycles driven mainly by Chinese construction demand.
- Agriculture remained the most weather-sensitive segment of the commodity complex, with El Niño risk now the dominant theme across grains, coffee, cocoa, and sugar heading into the second half.
The six-month period was a reminder that commodity leadership is fragmented rather than uniform: energy and industrial metals exhibited very different dynamics from those of precious metals and soft commodities, and currency effects mattered as much as the commodity moves themselves. The Canadian dollar’s historically tight link to oil prices has weakened since 2022 as the Bank of Canada-Federal Reserve rate gap widened, so Canadian energy and mining investors did not benefit from the currency tailwind that past oil rallies would have delivered.
Source: Providend
2. Energy: Oil and Natural Gas Volatility, but No Extreme Supply Shock
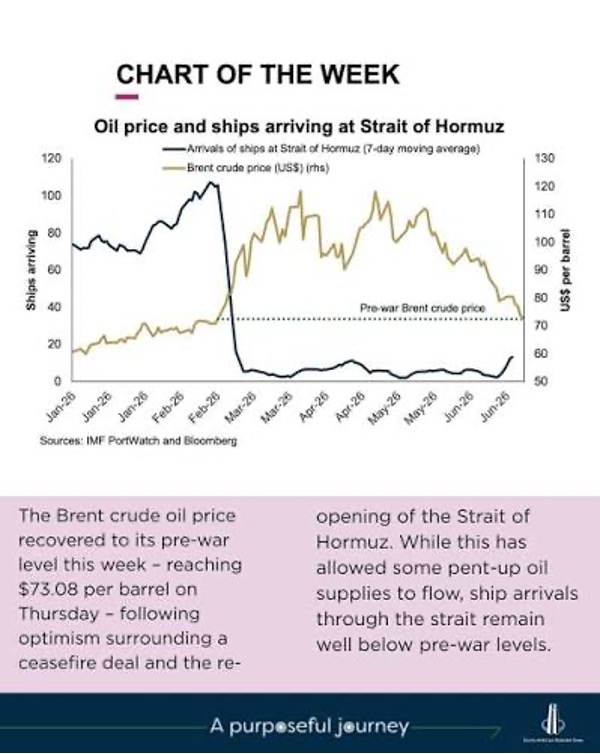
Oil was the standout commodity during the period, serving as a barometer of the geopolitical developments shaping the global landscape this year. When the US and Israel launched strikes on Iran in late February, Brent crude, which had been trading in the low $70s, spiked to the $140 range in early April – its highest level since 2008 – as Iran moved to close the Strait of Hormuz, through which roughly a fifth of the world’s seaborne oil and LNG normally passes. A ceasefire and memorandum of understanding between Washington and Tehran in June brought a sharp reversal, with Brent falling back below $72 and WTI into the high $60s by late June as flows through the strait returned to levels close to pre-war.
Hostilities resumed in mid-July, and by the third week of the month, Brent had climbed back to the mid-$80s and WTI to around $79-$80 per barrel as the US reinstated a naval blockade of Iranian ports. Even so, the pattern that stabilized prices earlier in the year held: OPEC spare capacity (led by Saudi Arabia), releases from strategic reserves, only temporary rather than sustained closures of the Strait, moderate underlying demand growth, and trader scepticism built up after several prior Middle East “false alarms” all worked to contain the rally relative to the scale of the disruption. OPEC cohesion itself came under strain, with the UAE exiting the cartel in May and Iraq pushing for a larger quota.
Natural gas told a more regional story. Henry Hub prices spiked towards US$7/MMBtu in January amid a polar vortex and record winter storage withdrawals, then collapsed below US$3/MMBtu by mid-March as mild spring weather, healthy injections, and expanding US LNG export capacity (including the Golden Pass and Corpus Christi Stage 3 terminals) restored a comfortable supply cushion. North American benchmarks remained soft for the rest of the half.
European gas prices diverged sharply. The Iran conflict disrupted an estimated fifth of global LNG supply at times during the first half of the year. The EU pressed ahead with its plan to phase out Russian gas by November 2027, and European gas prices, as measured by the Netherlands’ Title Transfer Facility (TTF), ran well above the roughly US$9.80/MMBtu average forecast for 2026 before the war began. The result was a spread of about $13/MMBtu at its widest, compared with barely any gap in January, with pricing highly sensitive to LNG cargo flows, storage levels, and industrial demand on both sides of the Atlantic.
3. Precious Metals: Safe-Haven Demand Returns
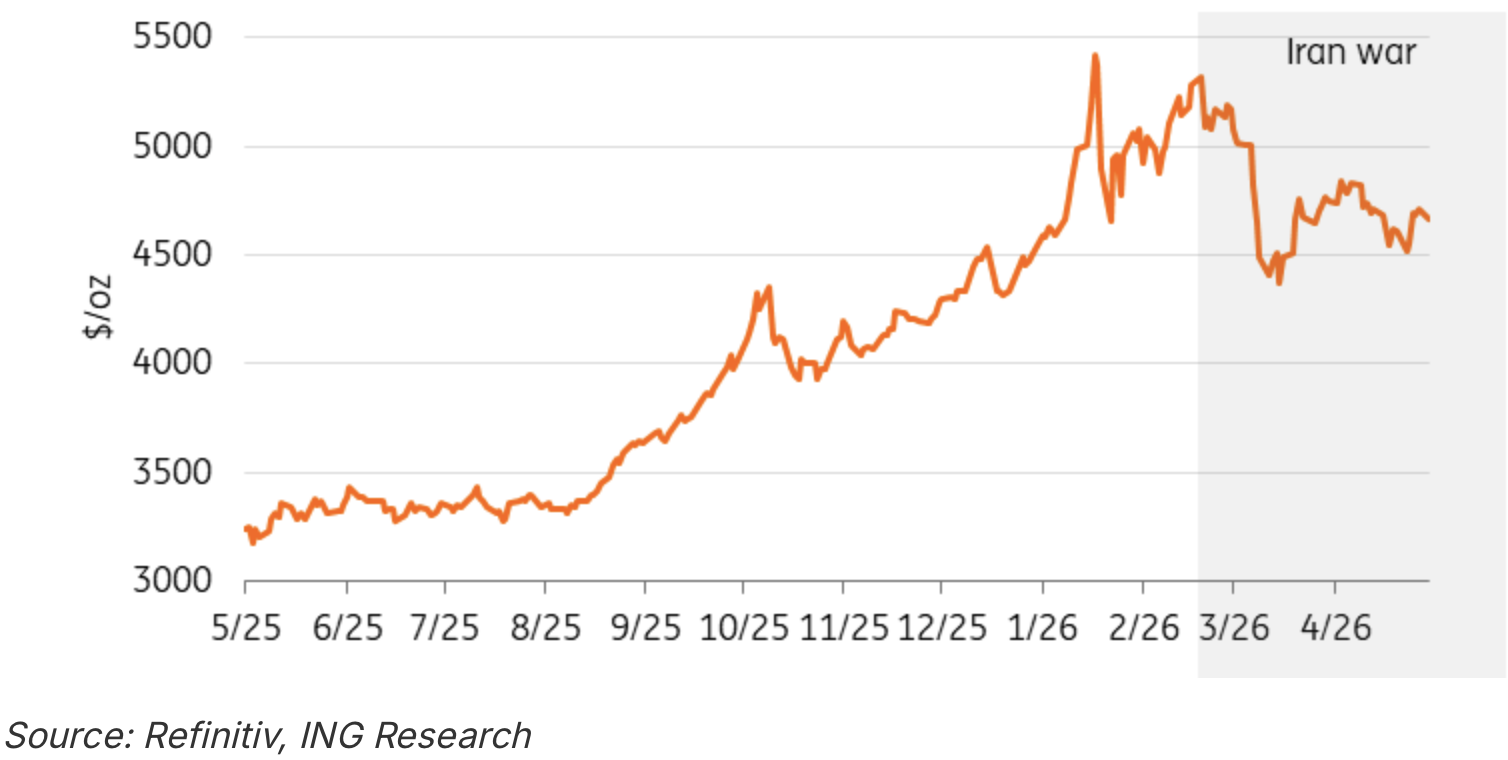
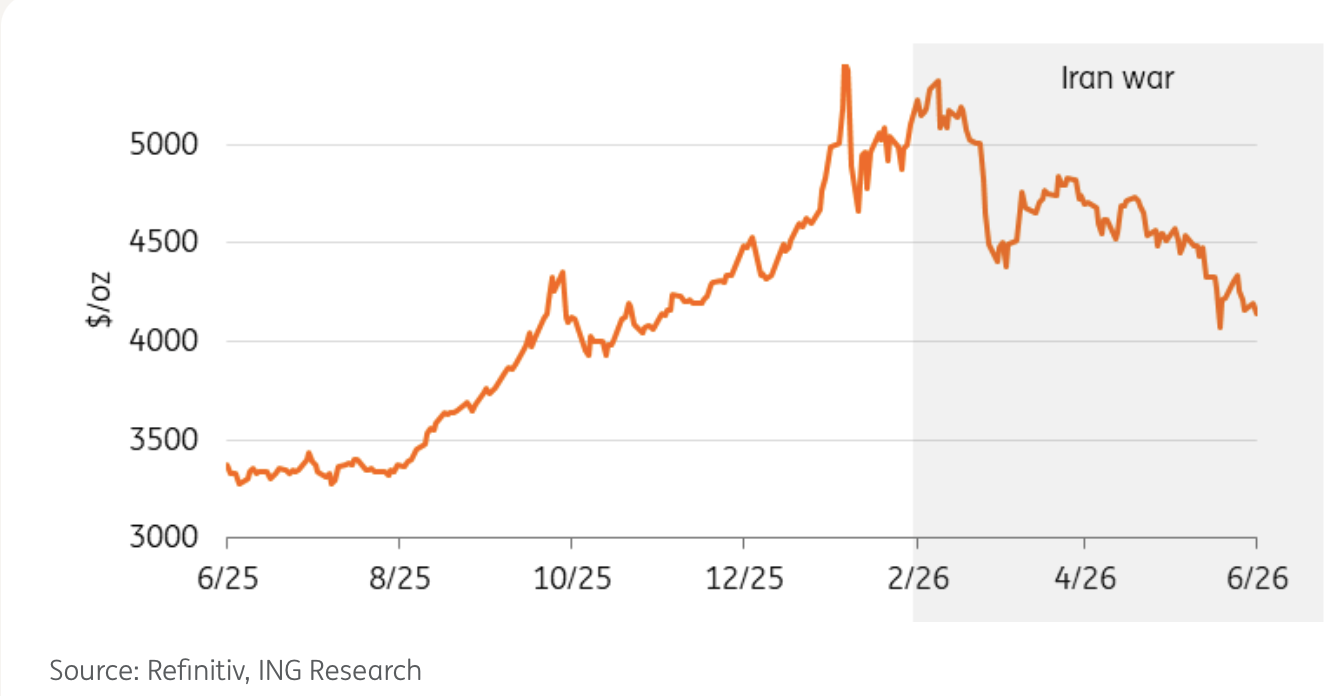
Gold had one of the most eventful openings to any year on record. After gaining roughly 64% in 2025, the metal pushed to more than 12 fresh all-time highs in the first half, peaking above US$5,600/oz intraday in late January (a London afternoon fix of US$5,405/oz) – a record reached barely 15 months after the previous cycle’s high, the fastest repricing in gold’s modern history. Drivers included geopolitical uncertainty around the Iran conflict, fiscal and inflation concerns, continued demand for portfolio hedging, and a marked pivot towards Asian buyers. Chinese net gold imports roughly tripled quarter-on-quarter in the first three months of the year, and mainland Chinese bar and coin demand rose 67% year-on-year, even as US-listed gold ETFs recorded record monthly outflows in March.
Then there was a sharp reversal in the precious metal’s price. A more hawkish tone from the Federal Reserve, associated with incoming chair Kevin Warsh, and a strengthening US dollar saw gold fall to roughly US$4,000-4,340/oz by mid-June, leaving the metal down around 7% for the half despite reaching its January record high. However, the extent of gold’s run-up over the last year meant it still ranked among the strongest-performing major assets over the trailing 12 months. Canadian gold miners felt the swing directly: on the TSX, names such as Agnico Eagle, Barrick Mining, Wheaton Precious Metals, and Franco-Nevada gave back gains as bullion corrected through the second quarter.
Why gold isn’t acting as a safe haven
 Source: https://za.investing.com/analysis/why-gold-isnt-acting-like-a-safe-haven-right-now-200619563
Silver’s first half was even more extreme than gold’s. The metal soared to a record US$121.64/oz on 29 January before plunging roughly 27% the next day amid the same hawkish Fed repricing that later weighed on gold. It then eased to around US$60-70/oz by mid-year. The gold-silver ratio, a rough gauge of relative value between the two metals, fell to a 14-year low near 50 at January’s peak – with silver possibly overheated relative to historical averages – before drifting back up to the low-to-mid-60s by June, still within the metals’ long-run historical range.
Beneath the volatility, the structural case for silver remained intact: a sixth consecutive year of a global supply deficit, tightening London inventories, and periodic lease-rate spikes indicating genuine physical scarcity, and industrial demand from solar, electric vehicles, electronics, and AI hardware now accounting for more than half of total consumption. Most major banks continued to expect silver to modestly outperform gold over the medium term, even after trimming their near-term price forecasts.
ING, for one, cut its silver price forecasts twice through the half—most recently in June, to US$68/oz for the third quarter and US$74/oz for the fourth, down from US$79 and US$84 previously—while maintaining that silver should still modestly outperform gold on the same structural deficits and electrification trends. The bank’s own analysts also flagged the flip side: having outperformed gold so sharply, silver was more exposed to a sharp retracement than gold if sentiment turned, a dynamic borne out by the metal’s 27% one-day plunge in late January.
4. Base & Strategic Metals: Structural Growth Story
Copper repriced decisively higher, with prices surging to record levels above US$13,000-14,500 per tonne (roughly US$5.65-5.75 per pound) in early 2026 before stabilising above the US$13,000 mark. The rally reflects copper’s transformation into what several analysts now call a core input for the “AI and electrification super cycle”. A single large AI data centre can require tens of thousands of tonnes of copper, electric vehicles use roughly four times as much copper as internal-combustion vehicles, and grid expansion for renewables adds further structural demand. Supply-side disruptions at the Grasberg mine in Indonesia and the Kamoa-Kakula mine in the Democratic Republic of Congo compounded already-tight refined output, though a stronger US dollar did trigger a brief pullback in March. Reuters’ January poll of analysts put the median 2026 copper forecast at its highest level on record, even before accounting for the subsequent rally.

Source: https://www.instagram.com/p/DafaiN2FpfX/
Uranium continued its re-rating. Spot prices jumped by roughly 25% in January, topping US$100/lb for the first time in two years, before consolidating through the second quarter in a US$84-87/lb range. Long-term contract prices, the benchmark utilities pay for multi-year supply, told a stronger story, reaching US$90/lb by the end of the first quarter (the highest since 2008) and, by some accounts, approaching US$150/lb for the longest-dated deals by mid-year. Drivers included US policy support for nuclear expansion (including a US$26.5 billion Department of Energy financing package for Georgia Power and Alabama Power, and a ban on Russian uranium imports), reactor restarts and life extensions, AI-driven electricity demand, and Kazatomprom’s decision to prioritise pricing over volume by trimming its 2026 output.
5. Soft Commodities: Underappreciated Source of Volatility
Corn, wheat, and soybean prices rallied through the second quarter, driven by El Niño-related weather risk and renewed Chinese demand. A European heat dome threatened grain supplies, particularly in France, while parts of the US Corn Belt faced late-season dryness. Soybean futures moved towards a May peak of US$12.14/bushel, aided by China’s confirmed return to purchasing US soybeans for 2026-27 delivery after months on the sidelines, before easing back to around US$11.50 in early July. Wheat found support from Black Sea shipping tensions linked to Russia-Ukraine strikes in the Sea of Azov. US soybean plantings for 2026 rose roughly 4-5% year-on-year to just over 85 million acres, underscoring how central the question of Chinese demand remains to the fortunes of these soft commodities.
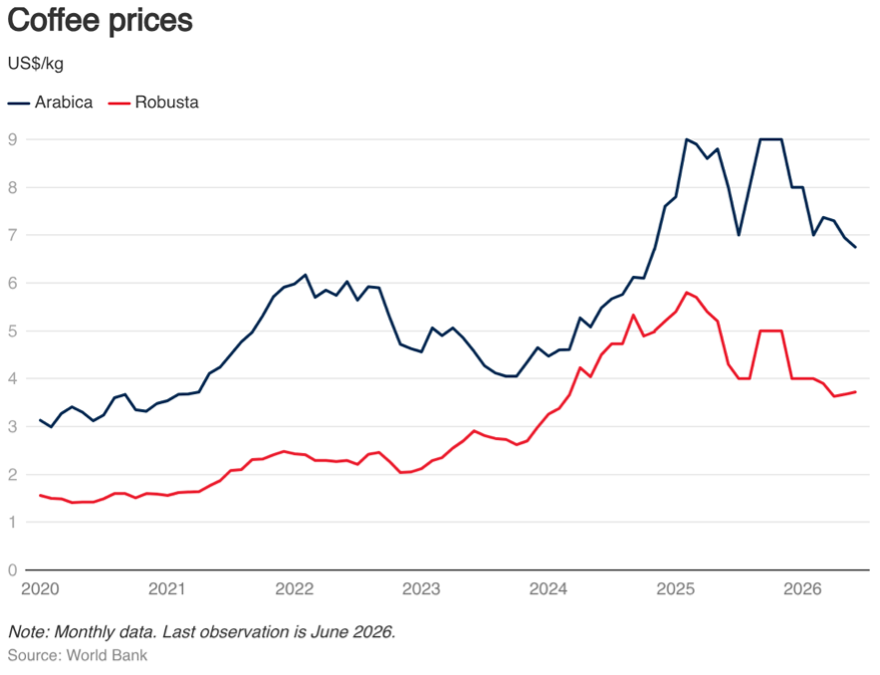
In contrast, coffee and cocoa prices fell as 2025’s supply shocks eased. Favourable weather in West Africa, where Côte d’Ivoire and Ghana together produce around 60% of the world’s cocoa, drove a strong production rebound. Cocoa averaged roughly US$4.35/kg in June, more than 50% below previous-year levels, while Arabica coffee prices were on track for a World Bank-projected 14% decline for the year as Brazilian and Colombian supply recovered. Late in the half, both markets staged a sharp reversal, with cocoa up roughly 34% and Arabica up roughly 29% from their June lows, as renewed heavy rainfall delayed Brazilian harvests and mounting concern grew that a strong El Niño could disrupt the 2026-27 season.
https://wandile.substack.com/p/coffee-prices-continued-to-ease-and
Sugar also rebounded towards the end of the six-month period, recovering around 10% after an ethanol-driven correction, as Brazilian mills again diverted cane to biofuel production. Forecasters have also begun revising away from an expected global sugar surplus towards a flatter, or even deficit, balance for 2026-27 should the developing El Niño intensify.
Cotton firmed through the second quarter, with benchmark prices climbing from the mid-60s early in the year to around 80 cents per pound by mid-July. The move reflects tightening fundamentals for the 2026-27 season. Global production is forecast to fall by roughly 5.5%, while mill use is expected to rise to a six-year high, pulling the stocks-to-use ratio down to its lowest level since the early 2010s. China remains the key swing factor, given its large stockpile.
Cattle markets remained exceptionally tight. The US herd continued a contraction that began in 2015, with total cattle inventory down to roughly 86.2 million head as of January 2026, keeping fed cattle, feeder cattle, and calf prices near record highs through the first half. Industry forecasters expect the average 2026 fed steer price to remain near US$224/cwt. Feed costs stayed relatively contained thanks to ample corn and soybean supply for much of the period, though cattle finishing breakeven prices still climbed into the US$240-250/cwt range as elevated feeder cattle costs offset cheaper feed.
Hog markets were firmer too: live-equivalent producer-sold hog prices traded in a range of US$63-69/cwt during the period, supported by resilient domestic pork demand and steady export growth, notably to Mexico and Japan. Across both cattle and hogs, disease cycles and seasonal grilling-season demand remained the swing factors to watch alongside the underlying feed-cost backdrop.
8. Conclusion: A Multi-Speed Commodity Market
The first half of 2026 confirmed the growing diversity of performance and fragmentation across the commodity complex. Energy was priced for geopolitical risk, and the durability of OPEC spare capacity and strategic reserves served as buffers against supply shocks. Precious and industrial metals went in different directions: gold and silver whipsawed amid the Federal Reserve changing policy expectations, even as their structural demand drivers remained intact, while copper and uranium extended a genuine, technology- and electrification-led structural re-rating with far less volatility. Soft commodities were driven largely by weather and supply-demand balances, with coffee and cocoa recovering from 2025’s shortages before turning higher again on fresh El Niño concerns, even as grains rallied on the same weather risk from the opposite direction.
Meanwhile, forecasters remain unusually divided heading into the second half of 2026, and much of that dispersion traces back to a single question: how long will the US-Iran war continue to disrupt the flow of critical commodities through the Strait of Hormuz? Consensus among analysts surveyed by Reuters in late May put full-year 2026 Brent averaging around US$90/barrel, but that poll was taken before the mid-June ceasefire briefly took hold, and views have fractured since.
Goldman Sachs and Morgan Stanley see Brent settling back toward US$60-75 as Gulf supply and OPEC+ quota increases normalize flows through the Strait of Hormuz, while the mid-July resumption of US-Iran hostilities is a reminder that a renewed closure remains a live tail risk that could just as easily push prices back toward the year’s highs.
For natural gas, the base case points to a quiet US summer below US$3/MMBtu before a seasonal fourth-quarter ramp-up toward US$4.00-4.50/MMBtu on LNG and heating demand, while European TTF pricing is likely to stay structurally elevated over Henry Hub for as long as the Russian gas phase-out and Gulf-linked LNG disruptions persist.
In precious metals, ING’s revised base case points to gold averaging US$4,300/oz in the third quarter and US$4,600/oz in the fourth, well below the January peak but still signalling a constructive outlook for investors. Silver is expected to range between US$68/oz and US$74/oz over the same quarters. More bullish houses such as J.P. Morgan continue to see gold pushing toward US$6,000/oz by year-end if Fed easing resumes.
Gold struggles despite geopolitical tensions
Source: https://think.ing.com/articles/golds-correction-prompts-a-forecast-reset/
Copper and uranium face fewer near-term crosscurrents, as structural AI, electrification, and nuclear expansion demand look set to keep both firm, though copper remains exposed to further supply disruption at Grasberg and Kamoa-Kakula, and uranium’s spot price will likely continue to take its cue from the widening gap already opening up versus long-term contract prices.
Agriculture is the wildcard, with the outlook dependent on whether the strengthening El Niño pattern delivers a full “Super El Niño”. This will largely determine whether coffee, cocoa, and sugar resume 2026’s earlier declines or extend their rebound towards the end of the first half. Grain and cotton prices are likely to remain tied to Chinese demand follow-through and Northern Hemisphere harvest weather.
Garnet O. Powell, MBA, CFA, is the President & CEO of Allvista Investment Management Inc., a firm that manages investment portfolios on behalf of individuals, corporations, and trusts to help them reach their investment goals. He has more than 25 years of experience in the financial markets and investing. He is also the Editor-in-Chief of the Canadian Wealth Advisors Network (CWAN) magazine. He can be reached at gpowell@allvista.ca