
2025: A Year That Tested Long-Held Commodity Assumptions
Why the most traded commodities are no longer the most economically significant
Rather than responding uniformly to global growth, inflation, or monetary policy, commodities revealed a growing structural split between markets driven primarily by financial activity and those influenced by economic transformation.
Oil, natural gas, and gold remained the most liquid and actively traded commodities, continuing to dominate trading screens and hedging activity. At the same time, the strongest long-term demand signals came from a different commodity grouping, namely copper, lithium, and battery-related metals, driven by renewable energy, energy storage, and the rapid expansion of data-centre infrastructure.
This divergence challenged long-standing assumptions about how commodity prices behave and what ultimately drives their value. Rising demand did not always translate into higher prices, while some of the most dramatic price moves occurred in relatively small, weather-exposed markets. The result was a year defined less by outright volatility than by contradiction, transition, and structural change.
Energy commodities still dominate global commodity liquidity
Oil and gas remained the backbone of global commodity trading in 2025. Futures and options volumes remained elevated, with CME Group, a leading derivatives marketplace, reporting record annual performance in its energy products segment for 2025. An 8% increase in energy average daily volumes to 2.7 million contracts was a new record, and Henry Hub Natural Gas futures and option average daily volumes also reached a record 567,000 contracts. This record trading activity reflects their ongoing central role in macro hedging, geopolitical risk management, and inflation sensitivity. Gold similarly retained its status as a highly liquid, globally trusted store of value.
A significant geopolitical development at the outset of 2026 highlighted the tension between headline risk and fundamental supply dynamics. US military action in Venezuela and the subsequent capture of President Nicolás Maduro generated immediate volatility in oil markets, with Brent and WTI both experiencing upward pressure as traders priced in geopolitical uncertainty. However, subsequent market analysis concluded that the actual impact on global oil prices would likely be limited.
Despite Venezuela holding one of the world’s largest proven oil reserves, decades of underinvestment, sanctions, and infrastructure decay had reduced the country’s output to roughly 1% of global supply (about 1 million barrels per day). Moreover, political control is highly unlikely to translate immediately into increased production, even under a US administration; meaningful increases in Venezuelan output would require years of investment and infrastructure rehabilitation to restore capacity to historical levels of 1.3 to 2 million barrels per day.
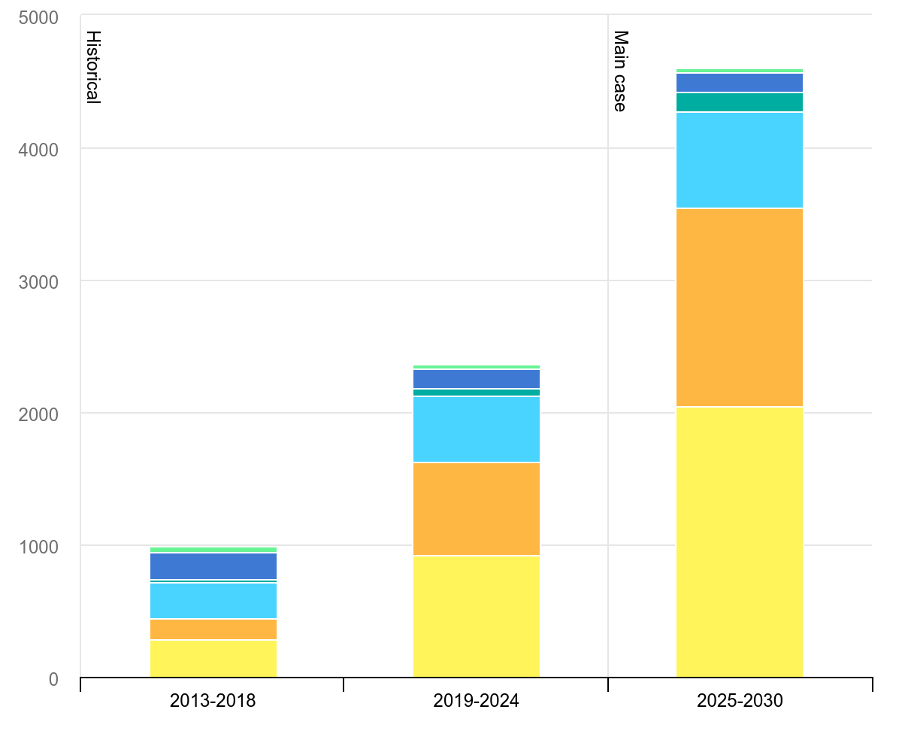
While energy commodities continue to dominate capital flows, their role as engines of incremental demand growth is increasingly being questioned. Most medium- and long-term outlooks now show global energy demand growth tilting toward renewable energy sources rather than fossil fuels, even as oil and gas remain indispensable to the current system. The IEA World Energy Outlook 2025 projects that a significantly accelerated deployment of clean energy technologies will increase renewable power capacity globally by about 4,600 GW by 2030.
Renewable electricity capacity growth by technology segment, main case, 2013-2030
![]()
https://www.iea.org/reports/renewables-2025/renewable-electricity
This distinction between liquidity today and growth tomorrow became one of the defining features of the commodity landscape in 2025, with energy commodity markets benefiting from decades of financialization, deep institutional participation, and a well-developed derivatives infrastructure.
Battery metals: the paradox of demand strength, price weakness
The most striking contradiction of 2025 emerged in battery metals. Demand for lithium-ion batteries accelerated in 2025, supported by electric vehicle adoption, grid-scale energy storage, and rising power requirements from AI-driven data centres. Structural demand growth for lithium, nickel, and copper remains compelling.
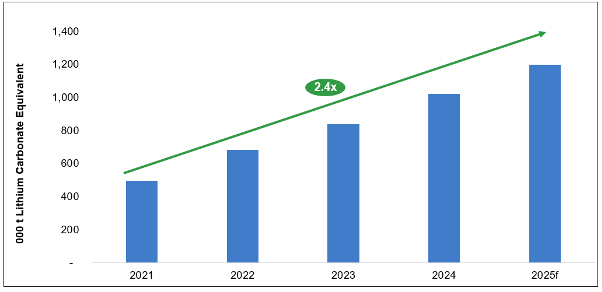
Lithium Demand is on the Rise
Sources: "Global Critical Minerals Outlook 2025," International Energy Agency (IEA), May 2025. S&P Global Market Intelligence, October 2025.

https://sprott.com/insights/lithium-gains-momentum-in-2025/#:~:text=Key%20Takeaways,reduce%20their%20reliance%20on%20China.
Yet battery-metal prices, particularly for lithium, proved volatile and often weak. Benchmark Mineral Intelligence data show that battery-grade lithium carbonate prices in China saw monthly swings of 10% to 20% at several points in 2025, as supply growth, led by China, Australia, and South America, outpaced near-term demand. Projects sanctioned during earlier price spikes came online just as markets became more bearish on EV penetration timelines and more conditional subsidy frameworks in the US and less generous in the EU.
This experience underscored a critical lesson: transition commodities are subject to industrial capital cycles, not just macro thematic narratives. Price weakness in 2025 reflected supply elasticity and timing mismatches, rather than a deterioration in long-term relevance.
Gold: A strategic shift in the buyer base
Gold’s record-beating performance in 2025 as the world’s traditional safe-haven investment is best understood not through price action alone, but through who was buying.
The gold price climbed as much as 55% during 2025, with the precious metal’s pricing surpassing $4,000/oz for the first time in October. JP Morgan attributes the historic upswing to trade concerns, reduced demand for the US dollar, and increased central bank buying, providing the ideal conditions for the upswing.
Central banks, particularly in emerging markets, were the dominant source of demand, with China, India, Turkey, Kazakhstan, and Uzbekistan among the most consistent accumulators during the year. At the same time, World Gold Council data showed that Gold ETF investment flows were volatile but also increased during the year.
Central bank gold buying has picked up pace in recent months
Monthly reported central banks’ activity, tonnes*
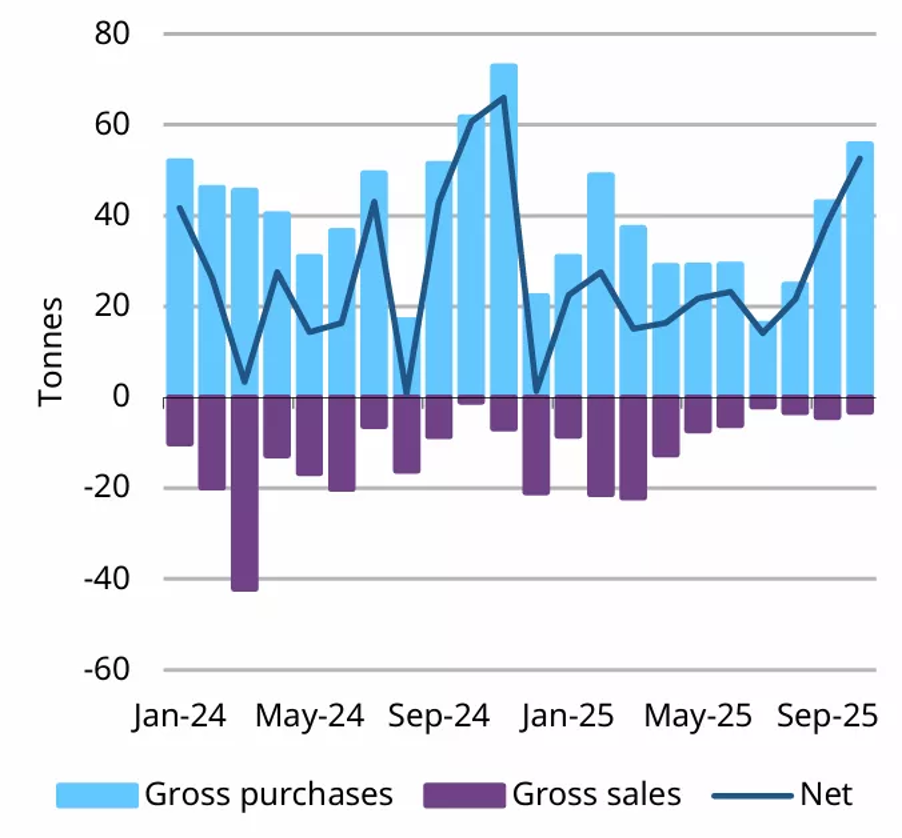
*Data to 31 October 2025, where available.
Source: IMF, respective central banks, World Gold Council
https://www.gold.org/goldhub/gold-focus/2025/12/central-bank-gold-statistics-central-banks-ramp-gold-buying-october
This strategic shift towards gold as a strategic reserve and investment asset, rather than a tactical inflation hedge, reflected growing concern about geopolitical fragmentation, sanctions risk, and long-term reserve diversification.
This marked evolution in gold’s role is expected to prove more significant than cyclical price drivers in the future, with JP Morgan Global Market Research predicting the price to average $5,055/oz by the final quarter of 2026, rising toward $5,400/oz by the end of 2027, reinforcing the metal’s growing relevance in portfolios exposed to geopolitical risk.
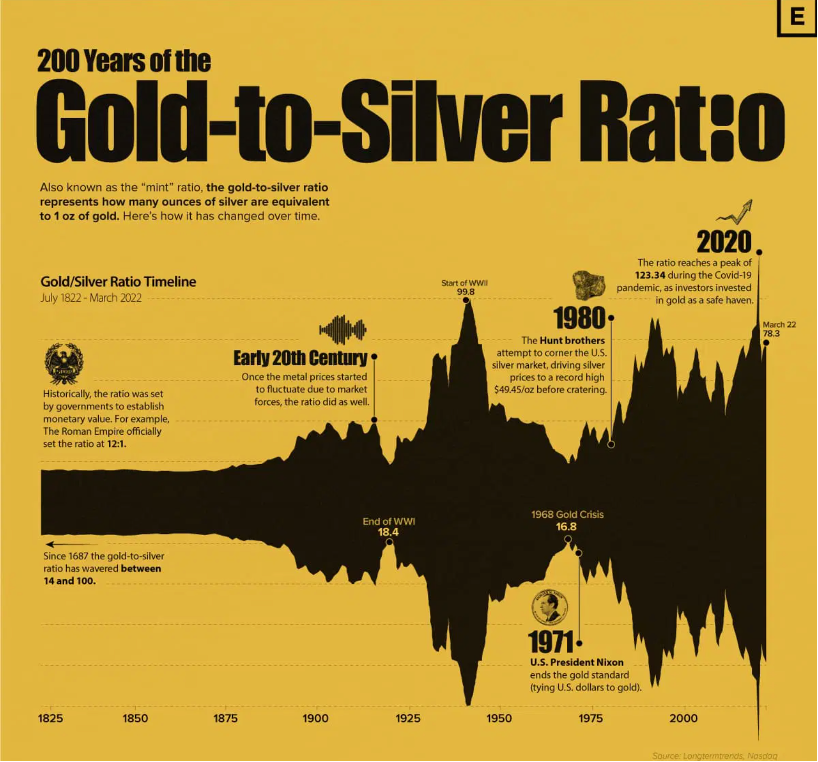
Silver: The high-beta precious metal and critical industrial asset
While gold delivered a historic 55% gain in 2025, silver delivered an extraordinary performance, surpassing virtually all major asset classes. Silver prices surged from a yearly opening of about $28.92 per ounce to a historic peak of $83.90 in late December, representing a total annual gain of approximately 145%, the sharpest appreciation since 1979. This rally was not merely a speculative phenomenon but the result of a multi-layered convergence of structural supply deficits, aggressive industrial consumption in green technology sectors, and silver’s traditional role as the high-beta alternative to gold in precious metals portfolios.
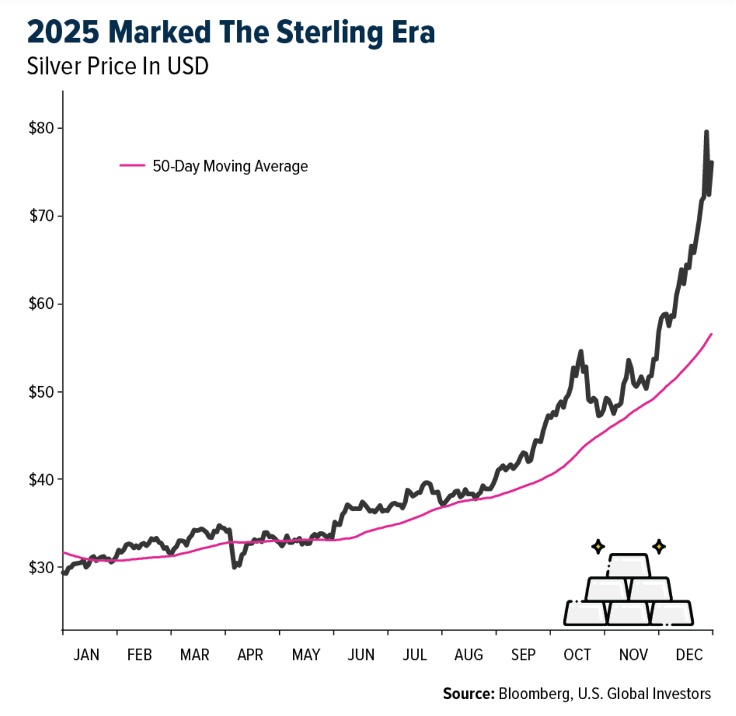
https://www.usfunds.com/resource/periodic-table-of-commodities-returns-silver-took-the-gold-in-2025/#:~:text=Investor%20Alert-,Periodic%20Table%20of%20Commodities%20Returns:%20Silver%20Took%20the%20Gold%20in,and%20inflation%20remained%20stubbornly%20high.
What distinguished silver’s performance from gold was its indispensable role in the global energy transition and digital revolution. Industrial demand accounted for about 60% of total silver usage during the year, driven primarily by three sectors: photovoltaics, which consumed over 200 million ounces (nearly 25% of annual global mine production), electric vehicles requiring 67% to 79% more silver per unit than traditional vehicles, and AI infrastructure where silver’s unmatched electrical and thermal conductivity made it irreplaceable in high-performance data centre systems.
The gold-to-silver ratio served as a primary indicator throughout the year, beginning at approximately 100:1 and compressing aggressively to around 60:1 by December as silver fulfilled its role as the high-beta precious metal. This compression to the historical long-term average reflected a fundamental re-rating of silver’s value, moving it from a secondary precious asset to a primary strategic commodity.
https://jrotbart.com/understanding-the-gold-to-silver-ratio-what-it-means-for-you-in-2025/
Soft commodities: Climate has become the price-setter
Some of the largest percentage price moves in 2025 occurred not in metals or energy, but in soft commodities. Cocoa and coffee prices surged in early 2025 and remained extremely volatile throughout the year, ending the year above pre-crisis levels as supply recovered.
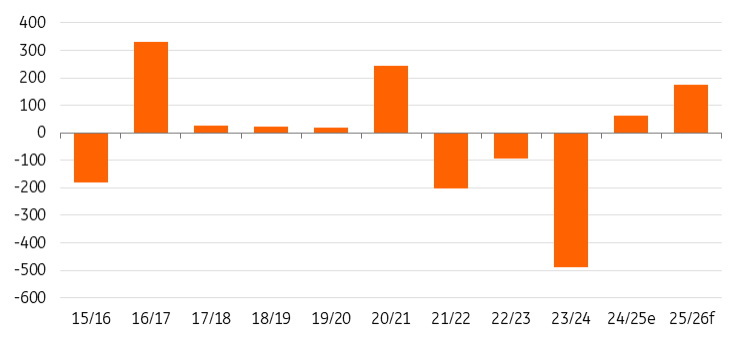
Cocoa market set for a larger surplus in 2025/26 (k tonnes)
Source: ING Research, ICCO
Intercontinental Exchange (ICE) cocoa futures reached a peak of US$11,107 per tonne in January 2025 on supply shocks experienced in West Africa, while Arabica coffee prices rose by as much as 50% during parts of 2025, and Robusta coffee prices posted double-digit percentage gains, due to weather disruptions in Brazil and Vietnam.
Importantly, the strong increases in prices of these two soft commodities were driven by supply shocks rather than demand booms. El Niño conditions and longer-term climate volatility reduced yields, highlighting the growing role of climate risk as a direct price-setting mechanism.
These episodes had an outsized impact relative to market size, underscoring how climate volatility can quickly translate into consumer inflation and political sensitivity.
Policy as a structural demand driver of soybean consumption
Another defining feature of the year was the growing influence of policy-driven demand. Soybean oil consumption rose sharply, not because of food demand, but due to renewable fuel mandates, particularly in the United States.
A growing amount of soybeans are needed to produce biofuels in the US (m bushels of soybean)
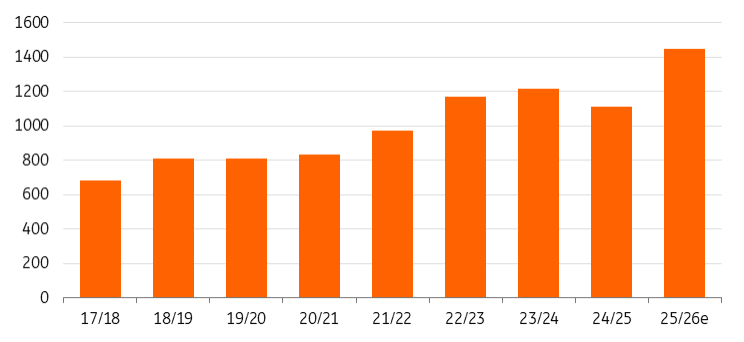
Using a conversion of 1 bushel produces 10.7 pounds of soybean oil
Source: USDA, ING Research
https://think.ing.com/articles/tighter-times-ahead-for-the-soybean-market/
The US Department of Agriculture sharply raised its forecast in July 2025 to a record 15.5 billion pounds for the 2025/2026 marketing year from 14 billion at the start of the year, while food, feed, and industrial use of the soft commodity remained broadly flat.
The reason for the shift in structural demand: biofuel incentives redirecting capital, trade flows shifting, and tightening feedstock markets. This reinforced the view that government policy now plays a central role in determining commodity demand, sometimes outweighing traditional economic signals.
Investment implications of a bifurcated commodity complex
By the end of 2025, the commodity universe appeared increasingly split between financially dominant commodity markets (oil, gas, gold), driven by liquidity, geopolitics, and hedging activity, and structurally critical markets (copper, lithium, battery metals), shaped by renewable energy electrification, policy, and industrial transformation.
This bifurcation helps explain why traditional signals, including inventory levels, demand growth, and price momentum, were often unreliable guides during the year.
Price trends in 2025 highlighted how commodities are being pulled in different directions by financial activity, macroeconomic policy shifts, and the commodities needed in the technology sector. Whether these tensions resolve or deepen will define future commodity trends and inform investors’ decisions in the years ahead.
Garnet O. Powell, MBA, CFA, is the President & CEO of Allvista Investment Management Inc., a firm that manages investment portfolios on behalf of individuals, corporations, and trusts to help them reach their investment goals. He has more than 25 years of experience in the financial markets and investing. He is also the Editor-in-Chief of the Canadian Wealth Advisors Network (CWAN) magazine. He can be reached at gpowell@allvista.ca